
Brent Crude Oil – Monthly Structure, Spot Market Behaviour and Sunday Open Scenarios
Disclaimer: This content is for educational and informational purposes only and is not financial advice, a recommendation, or a solicitation to trade. Markets are risky and decisions should be made with independent judgment and, where appropriate, professional guidance.
1. Monthly macro structure
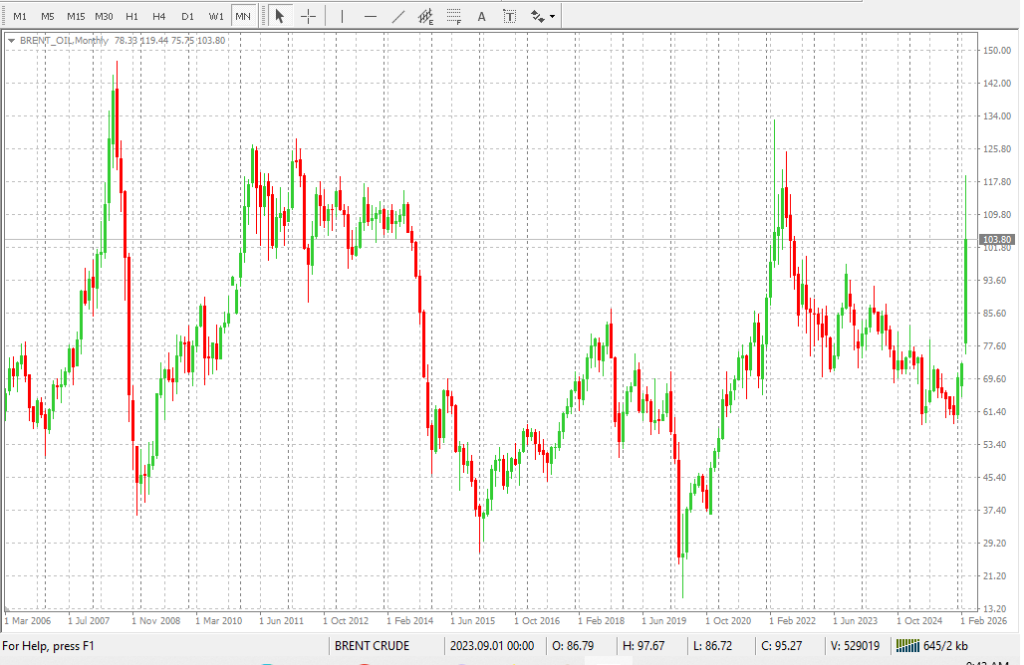
On the monthly timeframe, Brent Crude Oil is trading in a long-term structure defined by:
- Macro supply overhead: Historical highs and prior rally origins form strong supply zones at elevated prices, where long-term sellers have previously stepped in.
- Deep demand below: Multi-year bases and crisis lows form powerful demand zones much lower, where large buyers historically accumulated.
- Current compression: Price is oscillating in a broad range between major demand beneath and major supply above, reflecting a corrective, distribution-like phase rather than a clean trend.
On your chart, current price is trading inside a monthly supply region, where prior rallies have stalled and where institutional selling interest is likely to be concentrated.
2. Key zones and liquidity
From a structural and liquidity perspective:
- Active supply: The current price area, slightly above the psychological “round number” region, aligns with a fresh monthly supply zone created by a strong prior rally and subsequent hesitation.
- Nearby liquidity above: Recent swing highs and minor equal-high structures sit just above current price, acting as liquidity pools that may be swept before any deeper move.
- Liquidity below: Prior monthly lows and mid-range levels form obvious downside liquidity targets if sellers gain control.
In simple terms, price is trading at “premium” levels relative to the broader range, with clear liquidity resting both above (recent highs) and below (recent lows and mid-range).
3. How spot market traders are likely treating price now
Different spot market participants will typically frame this environment in distinct but overlapping ways:
3.1 Physical players and hedgers
- Producers: Many producers are likely to view current prices in monthly supply as attractive for locking in forward sales via hedging programs, especially if they see macro risks to demand.
- Consumers and refiners: Large consumers may be more cautious about aggressive hedging at these elevated levels, preferring to wait for potential pullbacks toward lower demand zones before committing to larger coverage.
3.2 Speculative spot and intraday traders
- Short-term bias: With price inside monthly supply, many short-term traders will lean toward a “sell premium, buy discount” mindset—looking to fade rallies into local intraday supply rather than chase breakouts.
- Liquidity focus: Intraday traders will watch recent highs above as potential liquidity sweeps (stop runs) that could precede reversals, and recent lows below as natural downside targets.
- Volatility expectation: Being at a structurally important zone, traders will generally expect higher volatility, with sharp moves around news, data releases, and geopolitical headlines.
3.3 Systematic and algorithmic flows
- Trend and momentum systems: Systems that read the prior impulse up may still be long-biased but will often reduce size or tighten risk as price stalls in supply.
- Mean-reversion and range systems: These will typically be active here, fading extremes and targeting the middle of the recent range rather than betting on sustained breakouts.
Overall, spot market behaviour at these levels is likely skewed toward cautious selling of strength and selective hedging, rather than aggressive new long accumulation.
4. Sunday night open – typical scenarios and likely behaviour
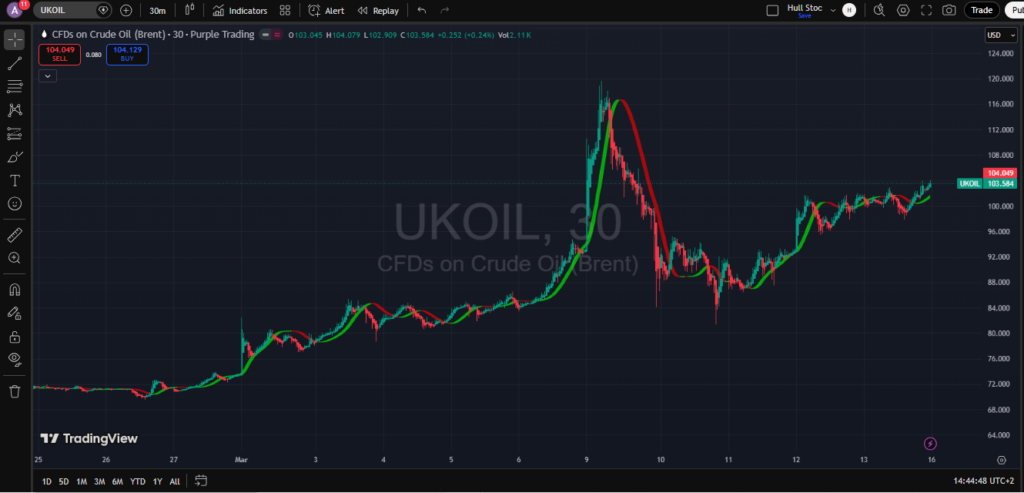
Because weekend news and geopolitical developments can significantly affect oil, spot traders usually prepare for three broad types of Sunday night opens:
4.1 Scenario A – Relatively flat or small gap
- Context: No major weekend shock; news flow broadly in line with expectations.
- Likely behaviour: Many traders will treat the open as a continuation of the current structure:
- Fade early spikes into nearby intraday supply within the broader monthly supply zone.
- Use early liquidity grabs (small stop runs above Friday’s high or below Friday’s low) as reference points for the week.
4.2 Scenario B – Gap up into or through supply
- Context: Bullish weekend headlines (e.g., supply disruptions, geopolitical tension, unexpected cuts).
- Likely behaviour:
- Short-term traders may look for a “gap and fade” if the gap pushes price deeper into monthly supply and then stalls.
- Some momentum traders will attempt to ride continuation if price holds above the gap and builds structure, but many will be wary of chasing at elevated levels.
4.3 Scenario C – Gap down away from supply
- Context: Bearish weekend headlines (e.g., demand concerns, macro risk-off sentiment).
- Likely behaviour:
- Short-term traders may look to sell failed gap fills if price attempts to retrace the gap and then rejects.
- Longer-term participants may start planning staggered buying only if price approaches much lower, well-defined demand zones.
In all cases, the monthly supply context means that gap-up opens are more likely to be treated with skepticism by mean-reversion and range traders, while gap-down opens may be seen as the early stages of a broader correction if follow-through selling appears.
5. Combined view – structure, spot behaviour and likely actions
Bringing the structural analysis and spot market behaviour together:
- Macro backdrop: Brent is trading inside a significant monthly supply zone, where historical price action suggests elevated risk of distribution and corrective moves.
- Spot trader stance: Many spot and short-term traders are likely to:
- Treat current prices as premium within the broader range.
- Prefer selling strength into local intraday supply rather than initiating fresh longs at these levels.
- Use nearby highs as liquidity zones that may be swept before reversals.
- Sunday open framing: Regardless of gap direction, the monthly supply context encourages:
- Cautious interpretation of gap-ups as potential exhaustion or overreaction, especially if price quickly stalls.
- Close monitoring of any gap-down for signs of a developing larger correction toward lower demand zones.
In summary, the combined view is that the market is in a high, structurally sensitive zone where many spot traders will lean toward defensive, mean-reverting behaviour—selling into strength, managing risk tightly, and watching how Sunday night’s open positions price relative to the broader monthly supply and nearby liquidity.
Again, this is an analytical framework, not a trading signal. Any actual trading decisions should be based on your own strategy, risk tolerance, and independent assessment.